
Labor Cost Benchmarking
Benchmarking Consortium
Measure academic and administrative labor costs and benchmark internally and externally against other members to inform strategic planning and manage budgets.


Trusted by


Conduct workforce planning.
Identify under-resourced areas for reinvestment, over-resourced areas for reallocation, and determine how competitive your institution is in recruiting and retaining staff.
Benchmark against member institutions.
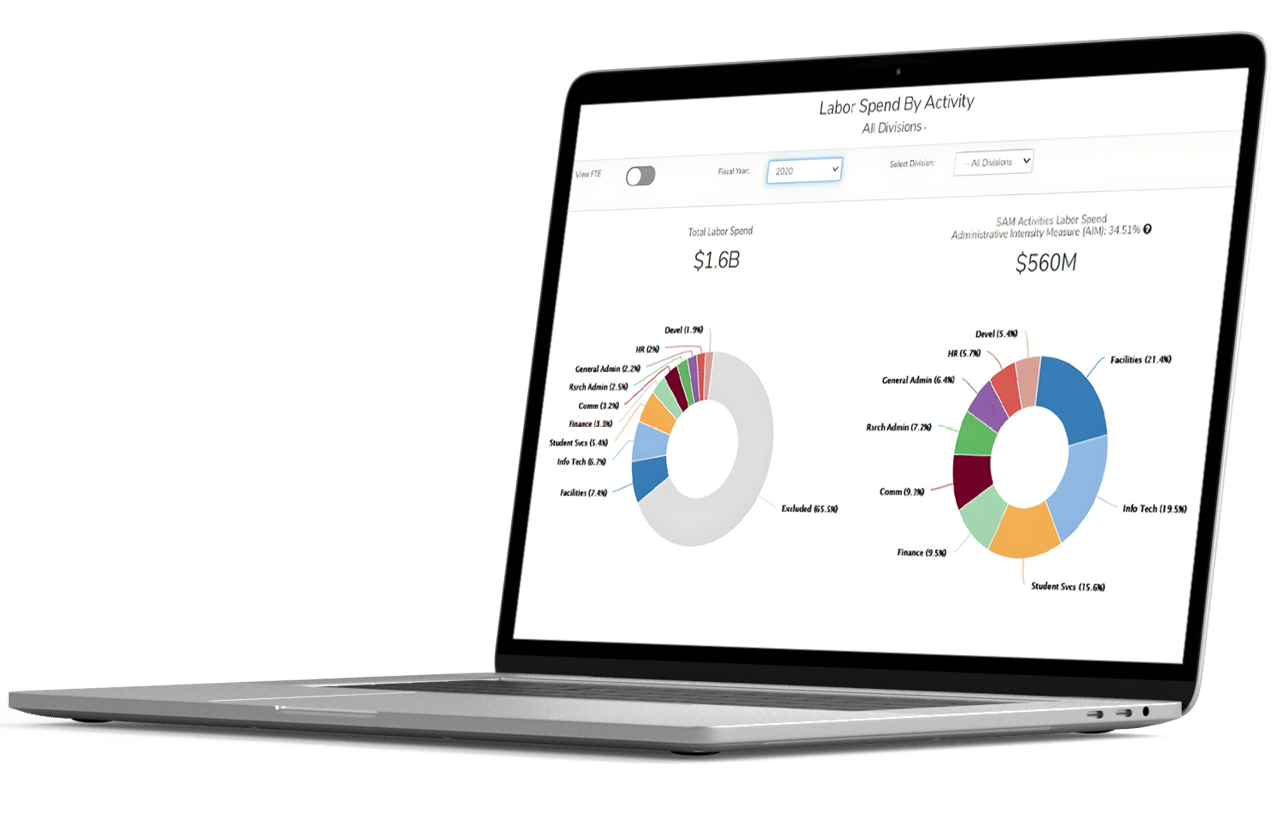
Understand how your investment in revenue-generating activities compares to other UC system institutions and other members.
Support key financial processes.
Put your data to work in aligning annual budgets, resource plans, and strategic planning.
Impact student success.
Demonstrate how labor spend investment can translate into improvements in enrollment, retention, and completion.
Demonstrate financial sustainability for accreditation.
Manage finances in alignment with your mission and strategic planning, plus provide evidence of good financial stewardship.
Unlock labor cost insights with the HelioCampus Benchmarking Consortium
.png?width=400&height=400&name=AQSS%20Laptop%20(2).png "ID: An open laptop with the results of a HelioCampus AQSS survey on the screen.")


Request a Demo
HelioCampus gives you a clear line of sight into financial risks and opportunities within your institution. Let us help you uncover unseen trends and insights to better inform budget cycles, workforce allocation, and strategic planning.