
Institutional Performance Management
The Blueprint for Continuous Improvement
Institutional Performance Management is a discipline borrowed from the most successful institutions and organizations centered on strategic planning, identifying risks and opportunities, and ensuring alignment across your institution.
.png)
Drive Enrollments
Use data insights to drive enrollments, improve student success and retention, and grow net tuition revenue.
Manage Expenses
Control costs in alignment with multi-year financial modeling that tracks to financial sustainability.
Improve learning outcomes
Prepare students to be successful in today's workforce, and facilitate a seamless accreditation process.
Choose an option:
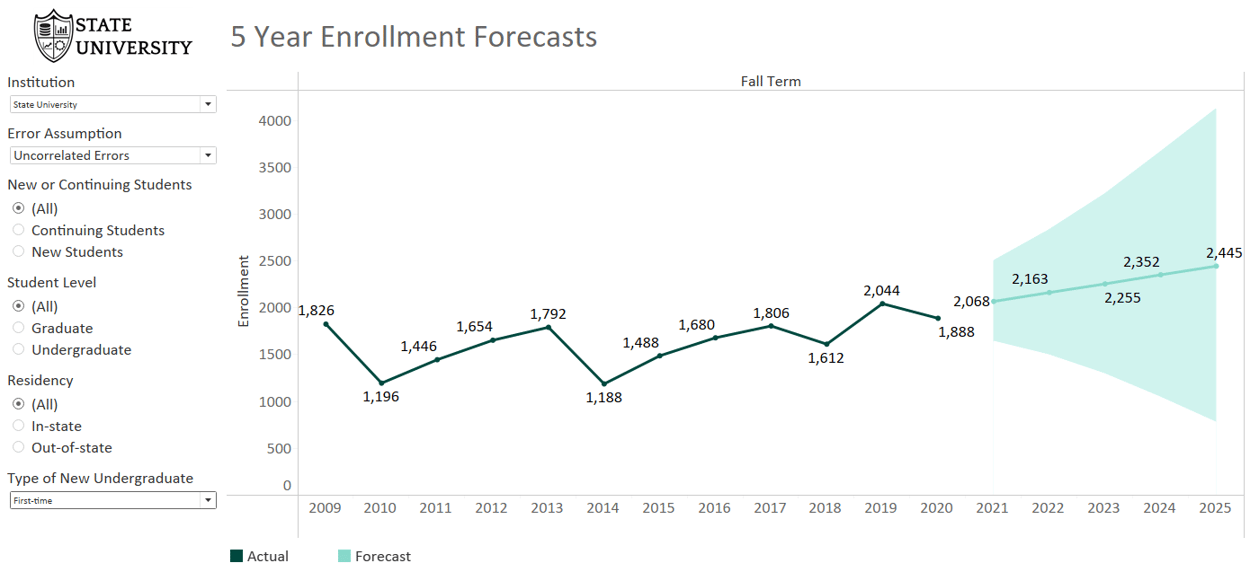
Enrollment Forecasting
Yield Modeling
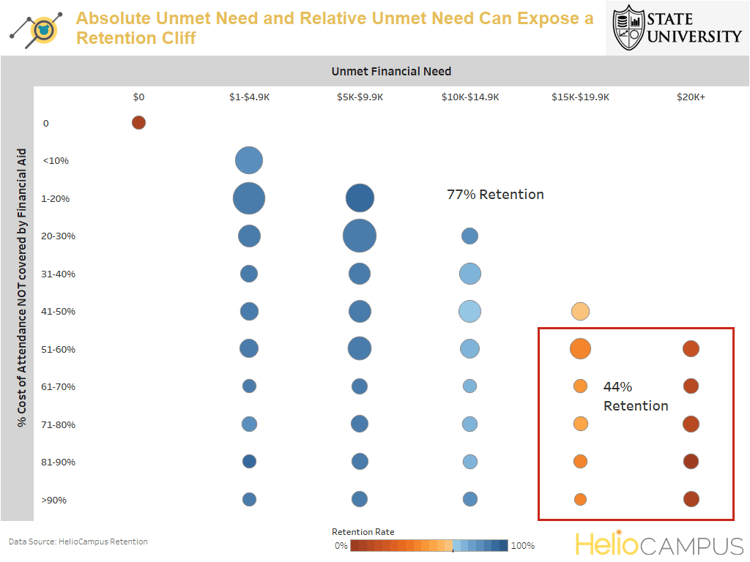
Optimizing Financial Aid
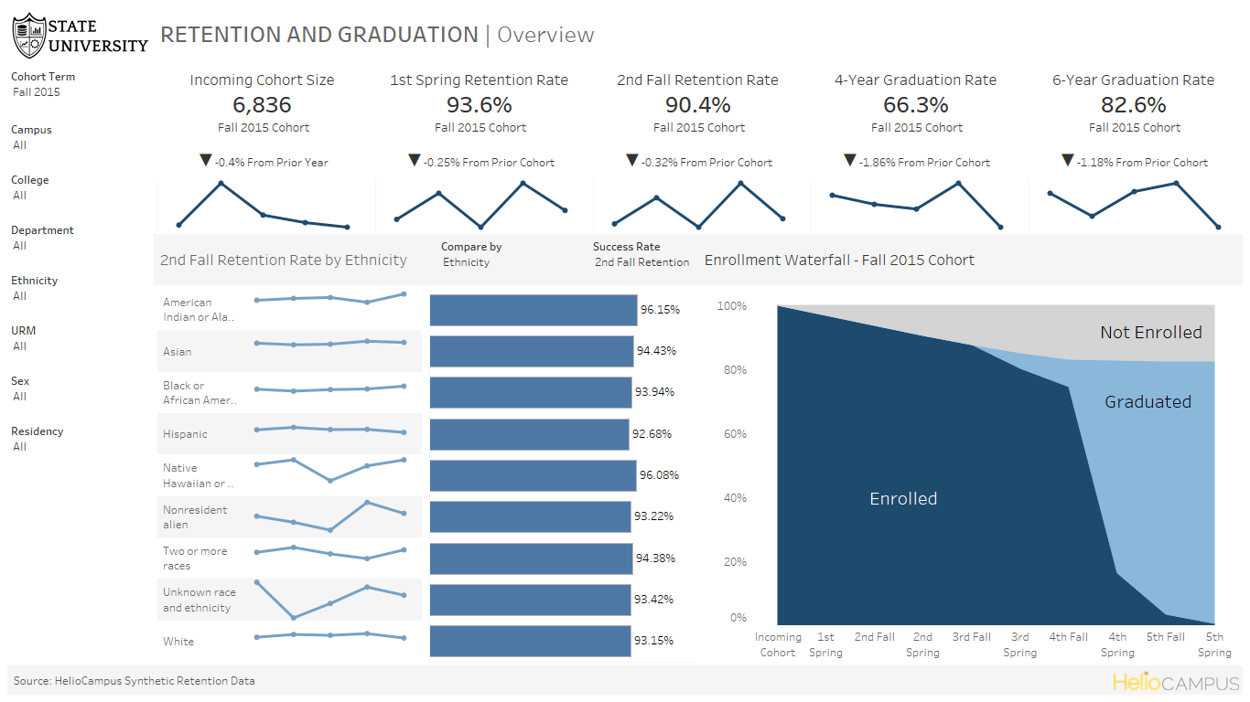
Retention Analyses
Choose an option:
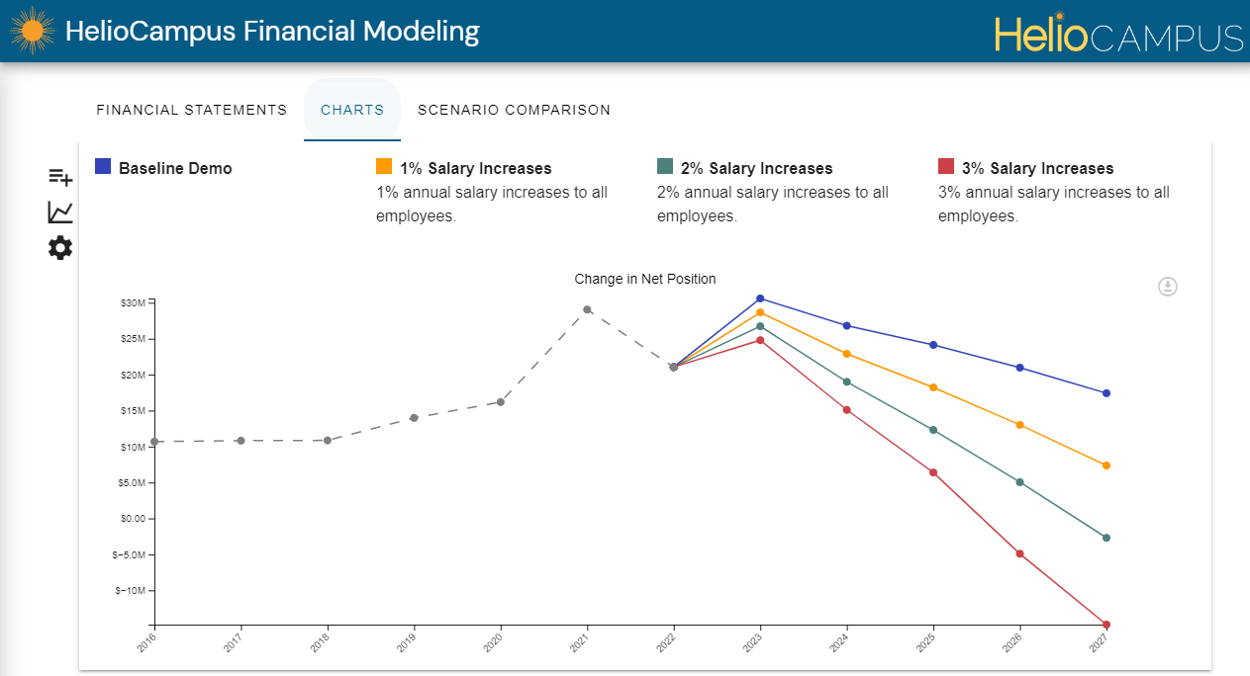
Multi Year Financial Planning
How are student demographic shifts impacting our financial picture?
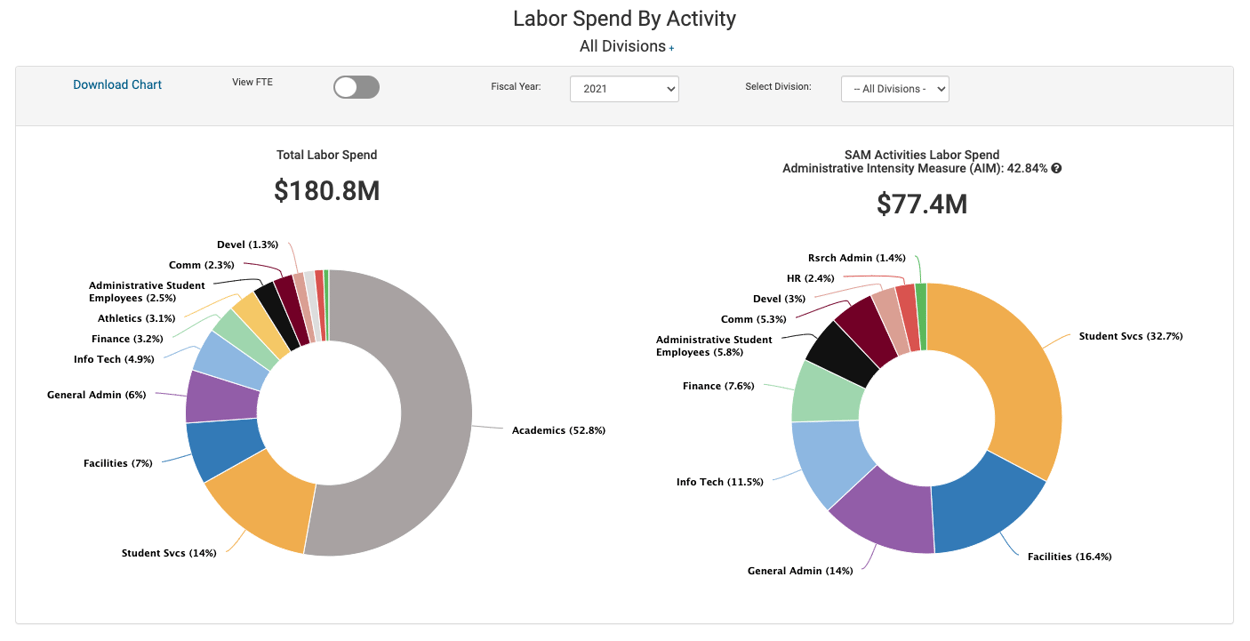
Labor Benchmarking
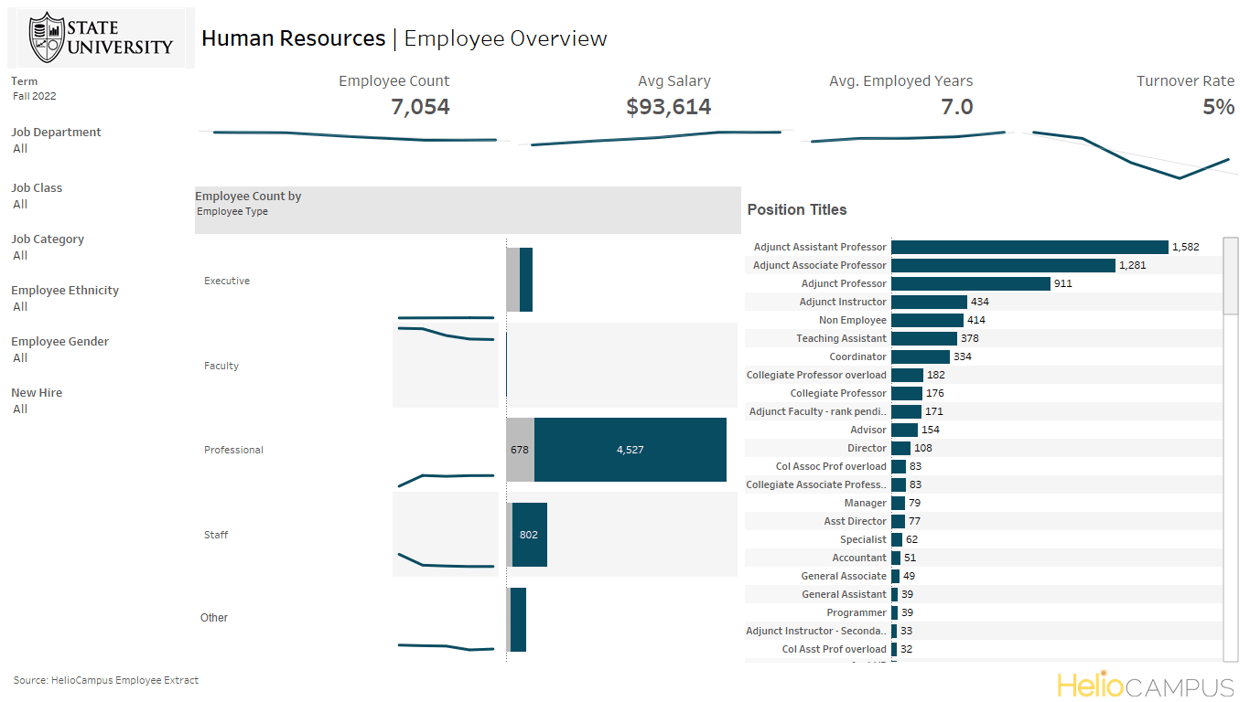
Workforce Planning
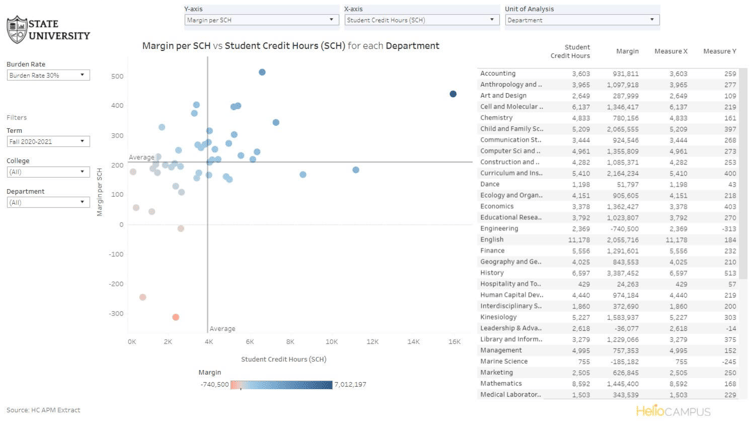
Contribution Margin Analysis
Course & Instructor Utilization
Choose an option:
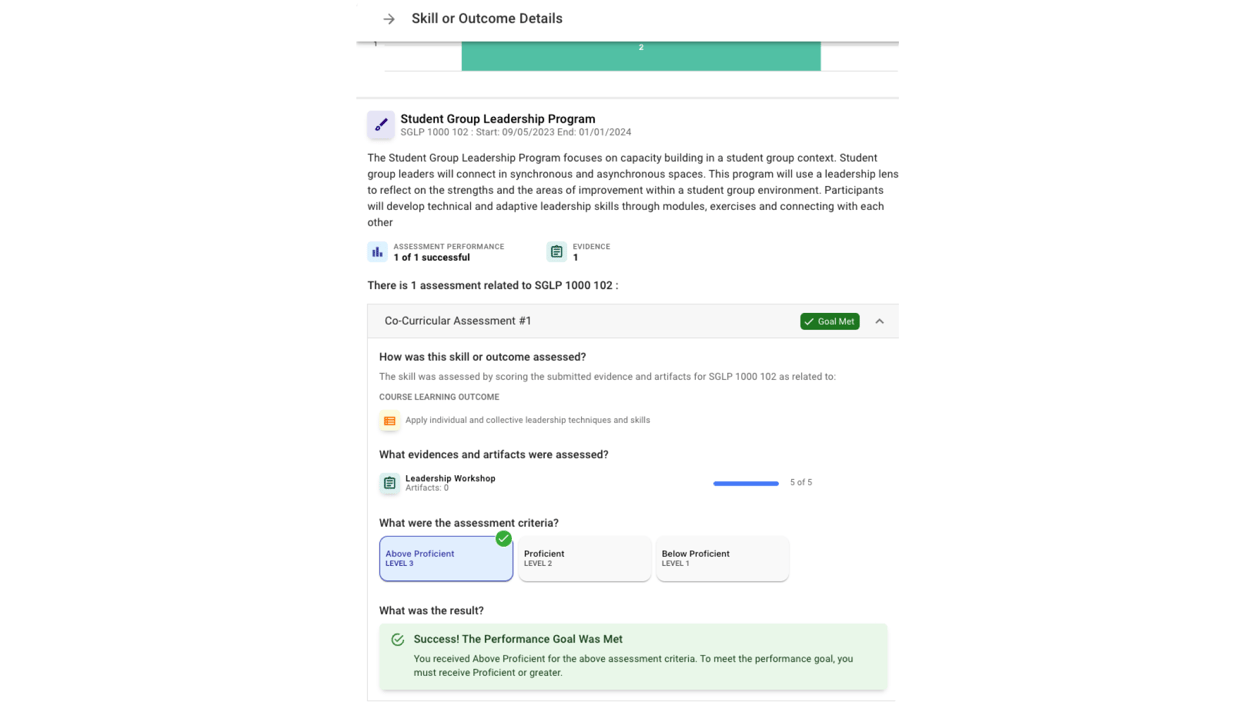
Accreditation Support
Outcomes Assessment
Course Evaluations
Skills Recognition
Choose an option:
Drive Enrollment
Enrollment Forecasting
Enrollment Forecasting
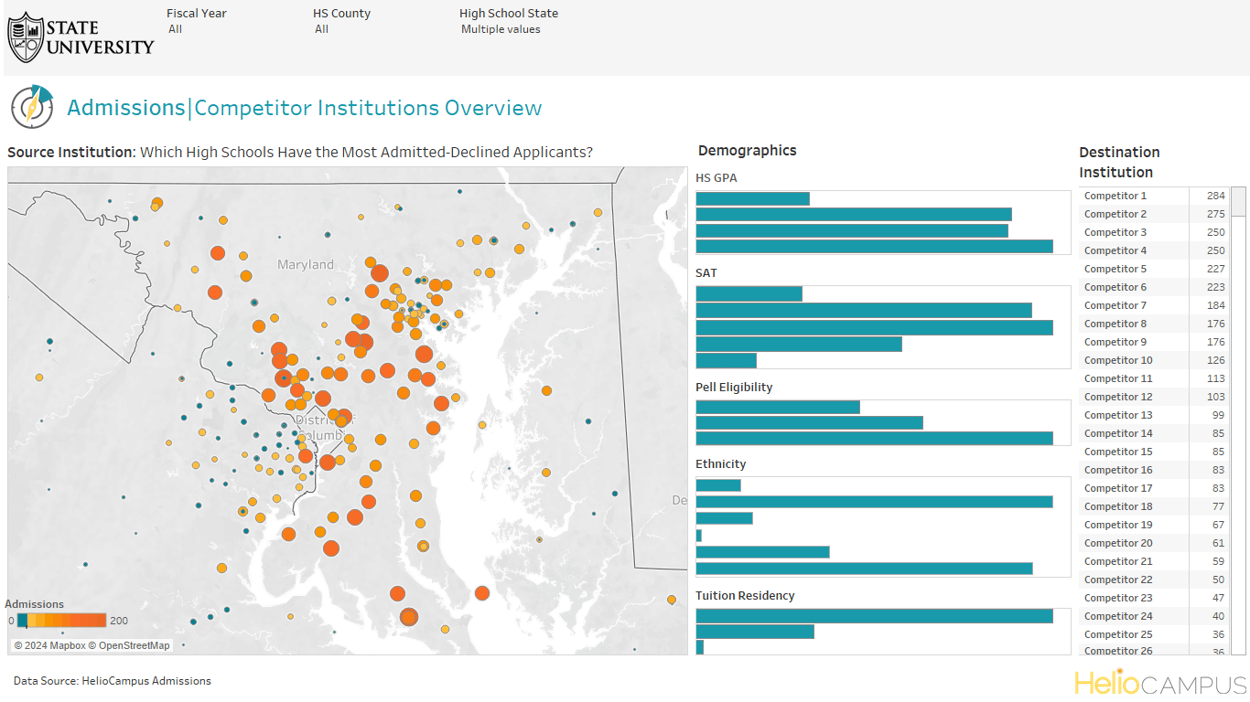
Yield Modeling
Yield Modeling
Optimizing Financial Aid
Optimizing Financial Aid
Retention Analyses
Retention Analyses
Manage Expenses
Multi Year Financial Planning
Multi Year Financial Planning
How are student demographic shifts impacting our financial picture?
Labor Benchmarking
Labor Benchmarking
Workforce Planning
Workforce Planning
Contribution Margin Analysis
Contribution Margin Analysis
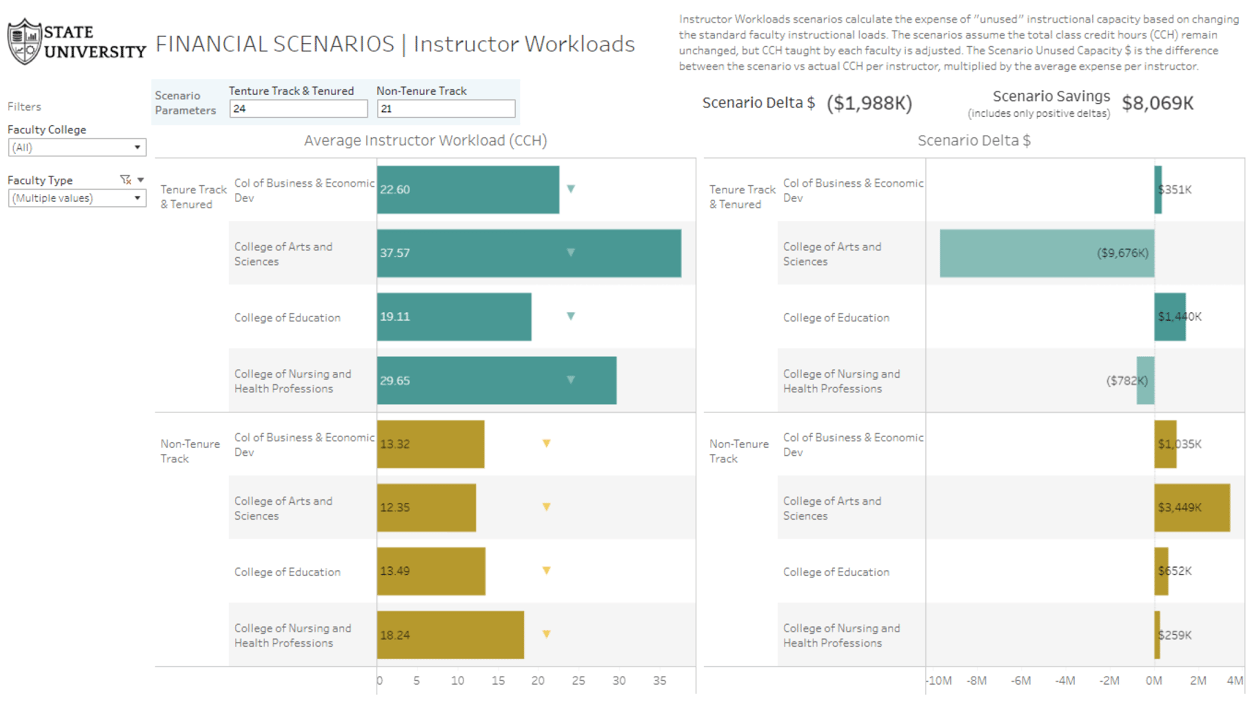
Course & Instructor Utilization
Course & Instructor Utilization
Improve Learning Outcomes
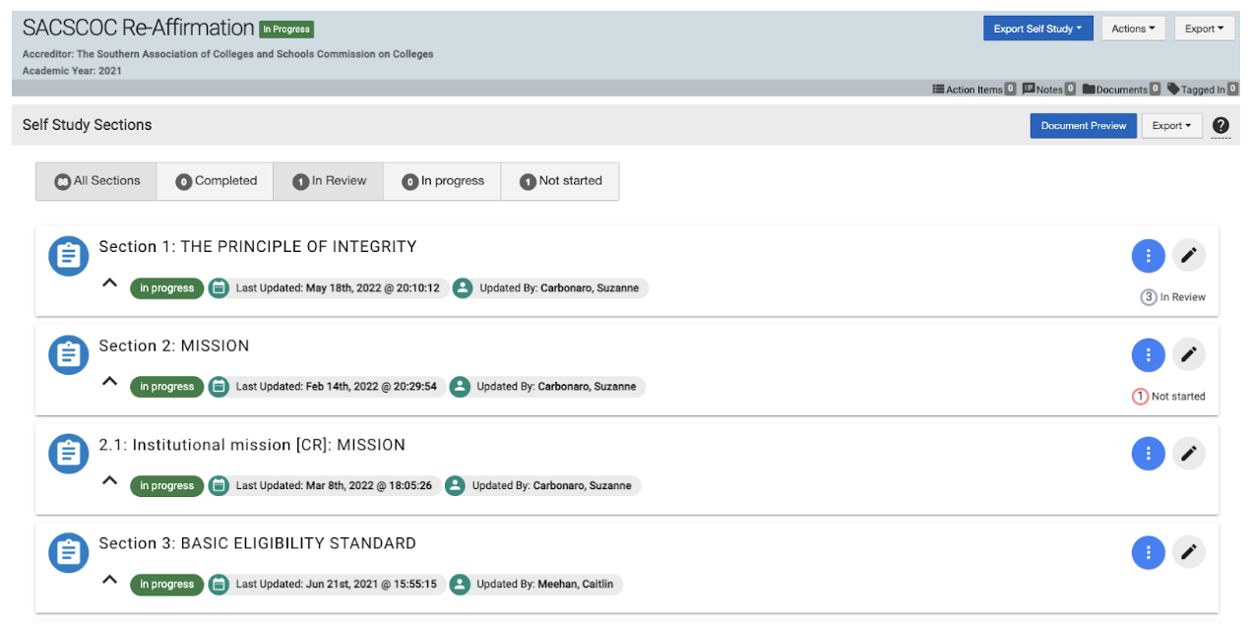
Accreditation Support
Accreditation Support
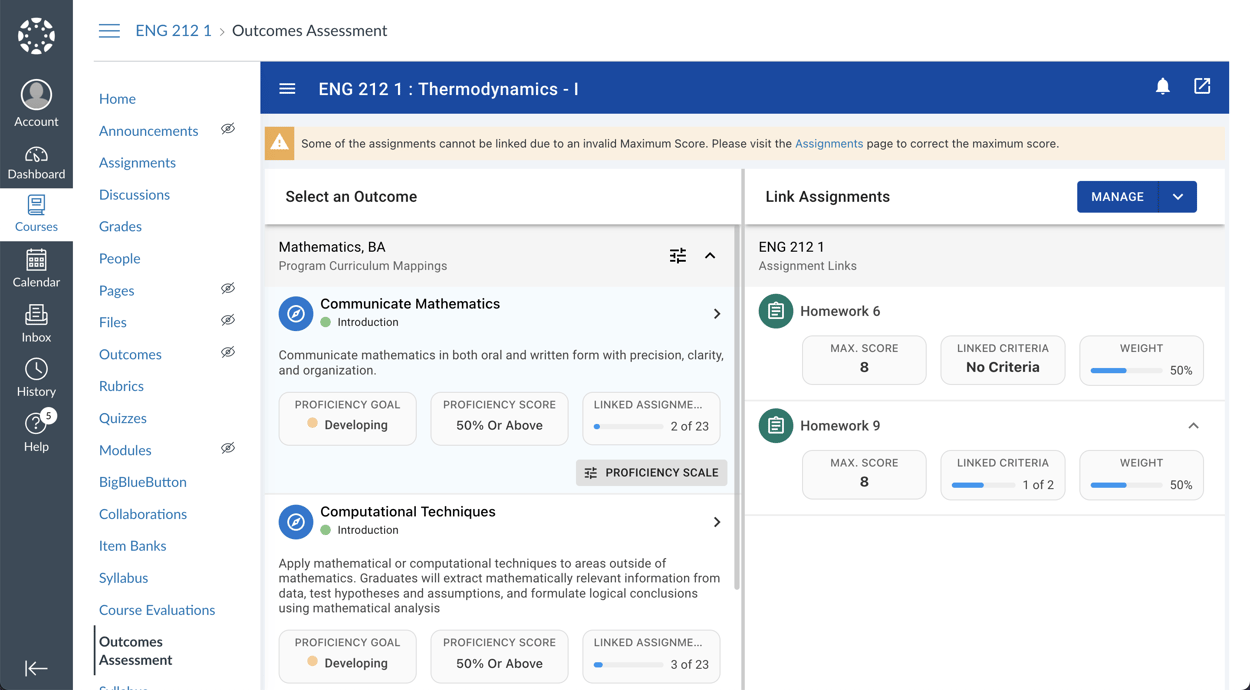
Outcomes Assessment
Outcomes Assessment
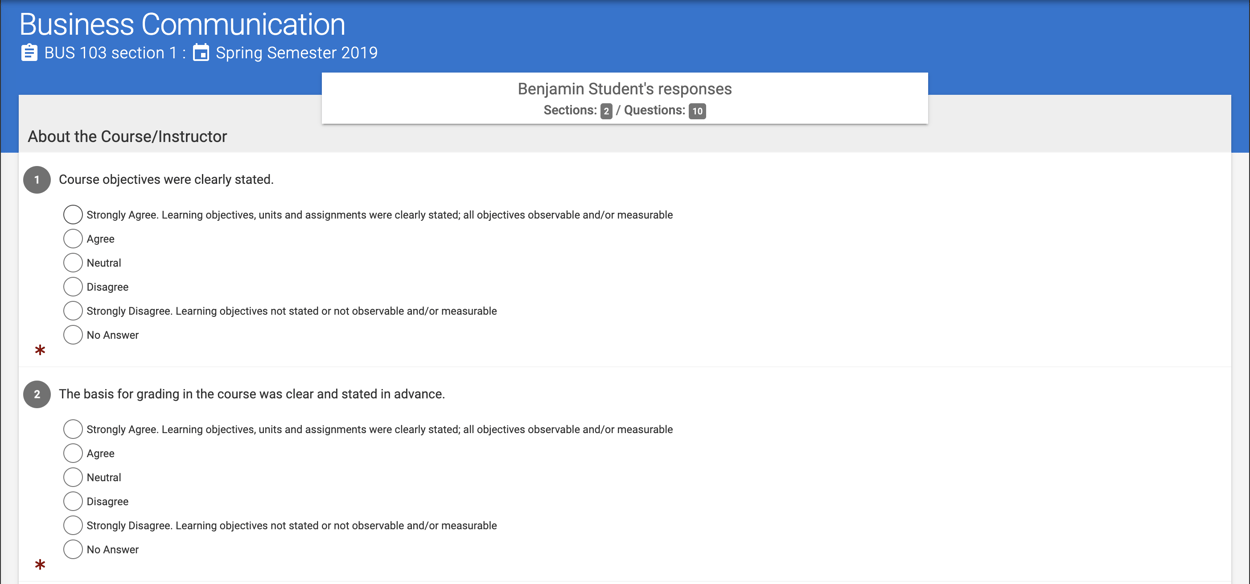
Course Evaluations
Course Evaluations
Skills Recognition
Skills Recognition
Choose an option:
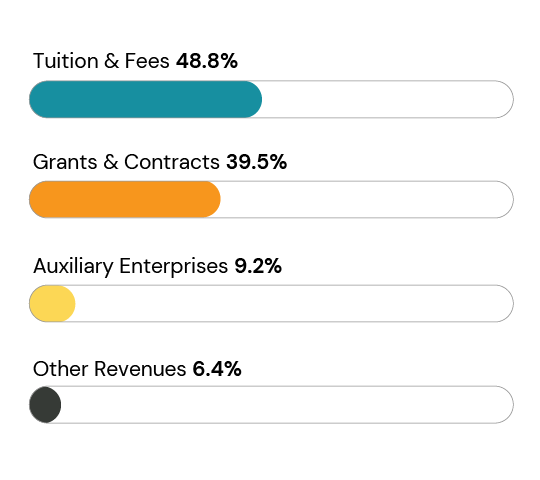
2-Year Public
Tuition & Fees (48.8%), Grants & Contracts (39.5%), Auxiliary Enterprises (9.2%), Other Revenues (6.4%)
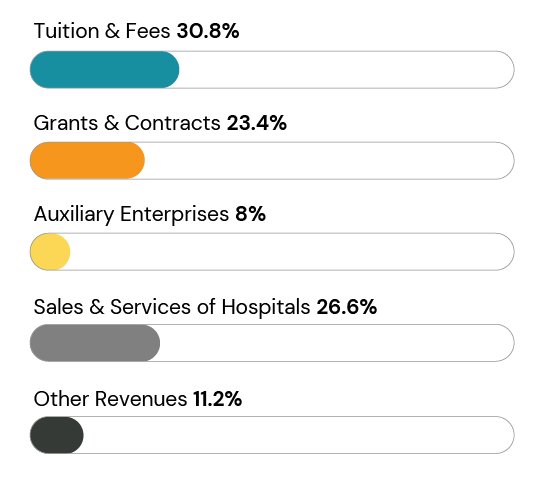
4-Year Public
Tuition & Fees (30.8%), Grants & Contracts (23.4%), Auxiliary Enterprises (8%), Sales & Services of Hospitals (26.6%), Other Revenues (11.2%)
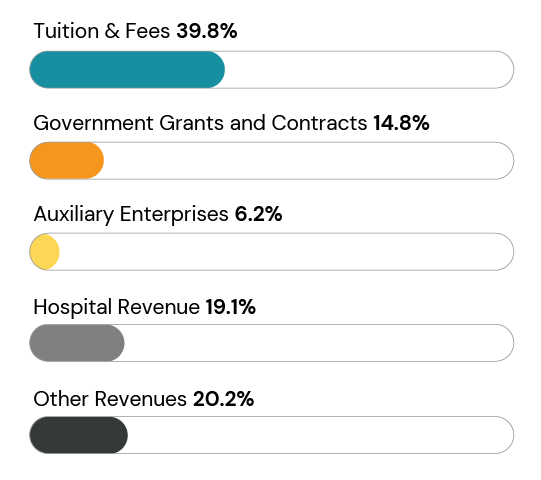
4-Year Private
2-Year Public
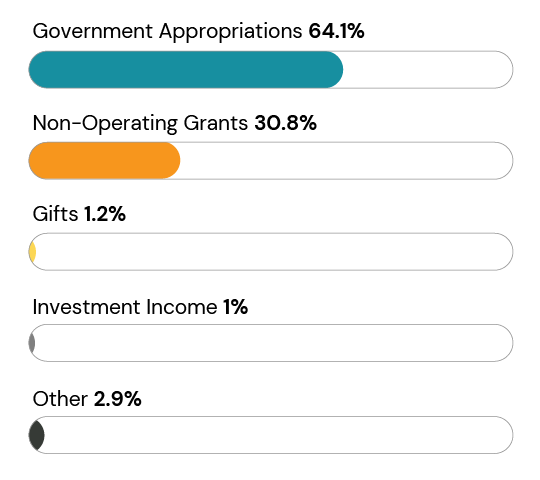
Government Appropriations (64.1%), Non-Operating Grants (30.8%), Gifts (1.2%), Investment Income (1%), Other (2.9%)
4-Year Public
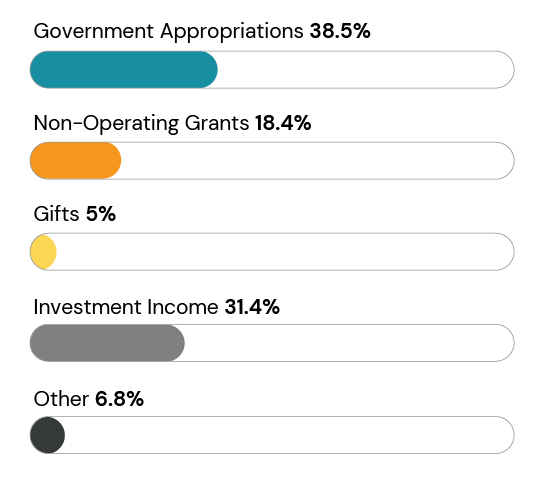
Government Appropriations (38.5%), Non-Operating Grants (18.4%), Gifts (5%), Investment Income (31.4%), Other (6.8%)
4-Year Private
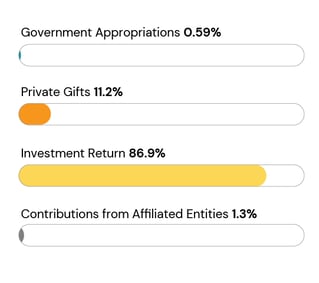
Government Appropriations (0.59%), Private Gifts (11.2%), Investment Return (86.9%), Contributions from Affiliated Entities (1.3%)
Choose an option:
2-Year Public
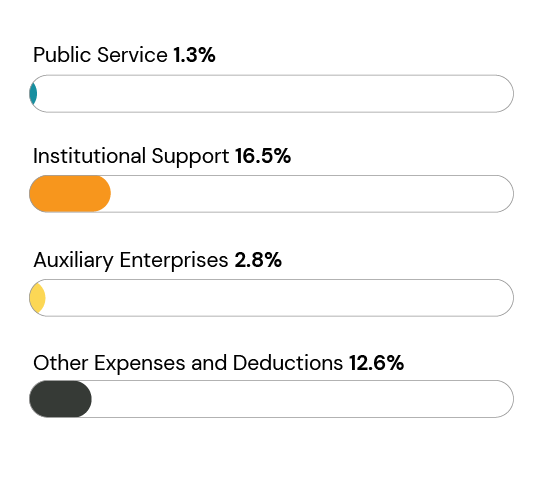
Public Service (1.3%), Institutional Support (16.5%), Auxiliary Enterprises (2.8%), Other Expenses and Deductions (12.6%)
4-Year Public
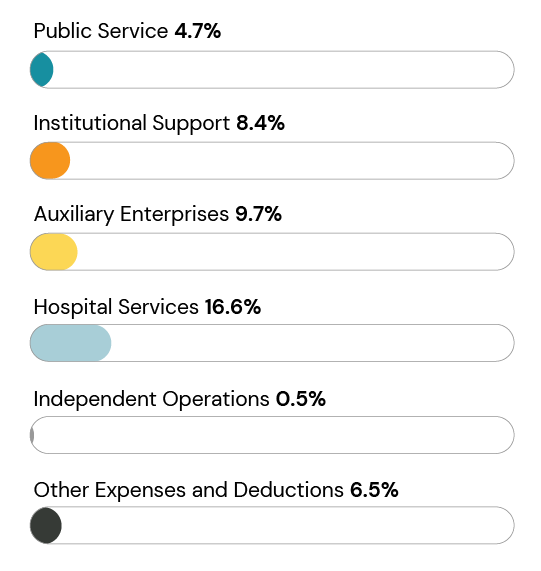
Public Service (4.7%), Institutional Support (8.4%), Auxiliary Enterprises (9.7%), Hospital Services (16.6%), Independent Operations (0.5%), Other Expenses and Deductions (6.5%)
4-Year Private
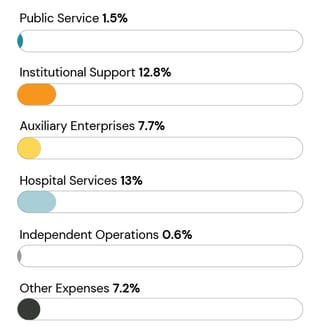
Public Service (1.5%), Institutional Support (12.8%), Auxiliary Enterprises (7.7%), Hospital Services (13.0%), Independent Operations (0.6%), Other Expenses (7.2%)
Choose an option:
2-Year Public
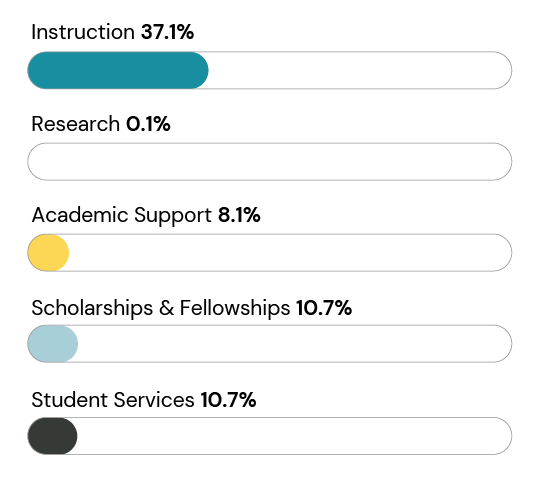
Instruction (37.1%), Research (0.1%), Academic Support (8.1%), Scholarships & Fellowships (10.7%), Student Services (10.7%)
4-Year Public
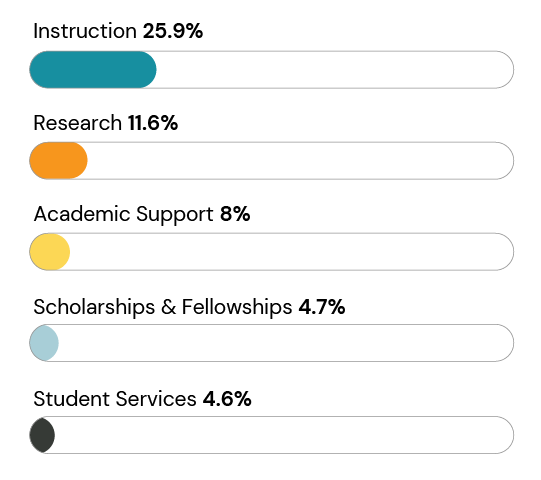
Instruction (25.9%), Research (11.6%), Academic Support (8%), Scholarships & Fellowships (4.7%), Student Services (4.6%)
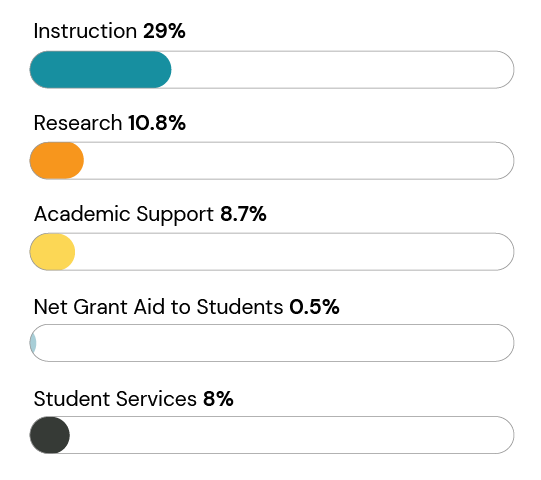
4-Year Private
Instruction (29%), Research (10.8%), Academic Support (8.7%), Net Grant Aid to Students (0.5%), Student Services (8%)
Choose an option:
Drive Student Success & Grow Revenue
Operating Revenues
2-Year Public
Tuition & Fees (48.8%), Grants & Contracts (39.5%), Auxiliary Enterprises (9.2%), Other Revenues (6.4%)
4-Year Public
Tuition & Fees (30.8%), Grants & Contracts (23.4%), Auxiliary Enterprises (8%), Sales & Services of Hospitals (26.6%), Other Revenues (11.2%)
4-Year Private
Non-Operating Revenues
2-Year Public
Government Appropriations (64.1%), Non-Operating Grants (30.8%), Gifts (1.2%), Investment Income (1%), Other (2.9%)
4-Year Public
Government Appropriations (38.5%), Non-Operating Grants (18.4%), Gifts (5%), Investment Income (31.4%), Other (6.8%)
4-Year Private
Government Appropriations (0.59%), Private Gifts (11.2%), Investment Return (86.9%), Contributions from Affiliated Entities (1.3%)
Manage Costs & Streamline Operations
Expenses
2-Year Public
Public Service (1.3%), Institutional Support (16.5%), Auxiliary Enterprises (2.8%), Other Expenses and Deductions (12.6%)
4-Year Public
Public Service (4.7%), Institutional Support (8.4%), Auxiliary Enterprises (9.7%), Hospital Services (16.6%), Independent Operations (0.5%), Other Expenses and Deductions (6.5%)
4-Year Private
Public Service (1.5%), Institutional Support (12.8%), Auxiliary Enterprises (7.7%), Hospital Services (13.0%), Independent Operations (0.6%), Other Expenses (7.2%)
Maximize Returns of Academic Programs
Expenses
2-Year Public
Instruction (37.1%), Research (0.1%), Academic Support (8.1%), Scholarships & Fellowships (10.7%), Student Services (10.7%)
4-Year Public
Instruction (25.9%), Research (11.6%), Academic Support (8%), Scholarships & Fellowships (4.7%), Student Services (4.6%)
4-Year Private
Instruction (29%), Research (10.8%), Academic Support (8.7%), Net Grant Aid to Students (0.5%), Student Services (8%)
Learn More about HelioCampus
HelioCampus exists to help higher education's most forward-thinking leaders navigate today's high stakes.
