Revenue Growth & ROI in Higher Ed
Student success and revenue growth
Target the right students, offer the necessary financial aid, and properly assess individual retention risks with timely insights to help you impact student success, while increasing revenue streams.

.png)

Next-level recruitment analytics
By surfacing previously unseen connections between recruitment data and student success, your enrollment management team can now focus, not only on following statistical progressions in tracking their ability to hit enrollment targets, but they can also unearth academic, social, financial, and other data points which lead to successful graduates. Delivering a class which not only meets statistical needs but also possesses heightened probability of retention, graduation, and alumni reciprocity—that’s next-level decision-making power.
Yield-maximizing financial aid packaging
Balancing the institution’s discount rate while checking the appropriate boxes for grants and scholarships is FinAid 1.0. Delve deeper into the data to explore where the tipping point for unmet financial need leading to stall-out, stop-out, and drop-out exists. Identify what combination of institutional grants and scholarship amounts delivers maximized yield. Recognize what aid types are most likely to promote student success. Graduate from dollars in a spreadsheet to immediate student impact with greater data clarity.
Deep dive academic programming insights
Tracking how many students are in a major doesn’t unveil the true impact of an academic department. Connect the dots between academic programs, student progress, and success rates to bring increased visibility to programmatic results—and even overall institutional ROI.
Unparalleled student success metrics
Move beyond 4- and 6-year graduation rates to truly identify metrics of ongoing student success. How are students of various ethnicities, genders, geographies, socioeconomic statuses, and other variables faring? What steps and interventions are working with some populations which can be provided to others? Manipulate data to compare subsets of students—whether demographically or academically—to discover trends that yield increased engagement, better course results, and improved graduation rates.


Turn the invisible dots into visible opportunities
Find out how HelioCampus Student Lifecycle can uncover previously disparate data points so you can act with data-backed insights for better student recruitment, enrollment, and retention.
Increase student success and grow revenue with HelioCampus
Student Lifecycle
Enable institutional stakeholders to quantify and understand the connections between admissions, enrollment, student success, and financial aid.
-
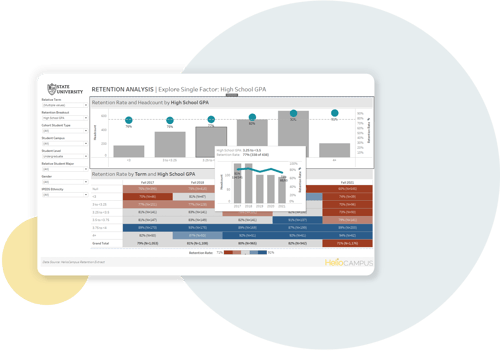
Measure and improve student persistence and retention
-
Identify areas to optimize recruiting, financial aid, or admissions processes to maximize enrollment yield
-
Empower strategic decision making across academic and administrative functions
Student Lifecycle
Enable institutional stakeholders to quantify and understand the connections between admissions, enrollment, student success, and financial aid.
-
Measure and improve student persistence and retention
-
Identify areas to optimize recruiting, financial aid, or admissions processes to maximize enrollment yield
-
Empower strategic decision making across academic and administrative functions
Request a Demo
HelioCampus enables you to get answers to pressing questions impacting student success and campus operations. Let us work with you to integrate your core systems, build a secure data platform, and visualize yet-to-be-uncovered data insights.