Skip to content

STONY BROOK UNIVERSITY CASE STUDY

How Trusted Labor Cost Data Turns Belief Into Investment

A flagship research university builds a culture where labor cost data is credible enough to change budget decisions —and durable enough to last.

Stony Brook Case Study Logo

Stony Brook University, a flagship of the State University of New York system, serves more than 27,000 students and 17,000 employees, including its health system. A member of the Association of American Universities (AAU), Stony Brook generates more than $370 million in annual research expenditures, co-manages Brookhaven National Laboratory on Long Island, and serves as the anchor institution for the New York Climate Exchange on Governor's Island. About two-thirds of its degrees are conferred in STEM and health fields, alongside nationally recognized programs in the social sciences and humanities.

Case Study Highlights

An illustration of a teal circular dollar sign icon paired with a grey speedometer-style gauge indicator pointing to the right.

$370m in research

per-student and per-research-dollar comparisons show Stony Brook where it truly stands among larger AAU peers.

An illustration of a grey lightbulb outline containing a purple pie chart icon centered inside the bulb.

4 budget questions

benchmarking answers, "How do we compare?," the one question internal data can't.

An illustration of three grey arrows pointing into a square box that merges data nodes into a single grey arrow pointing out the right side.

3 teams working together

finance and budget teams map labor data with each unit, so leaders trust the results
An illustration of a winding grey roadmap with circular milestone nodes leading toward a teal destination flag at the top.

2 new uses

the data now supports Stony Brook's accreditation self study and the President's Advisory Budget Committee

The challenge

For years, individual units across Stony Brook made the case that they were underfunded relative to peers, pointing to national benchmarks to back up their argument, but without a credible, apples-to-apples way to compare spending across institutions, those comparisons rarely carried enough weight to change minds in the budget office. Finance leadership faced the same gap from the other direction: internal trend analysis could describe Stony Brook's own operations, but it couldn't say where the institution was underinvesting, or spending more than it should for what it was getting, relative to peers — and that comparison was the missing piece.


Braden Hosch, Vice President for Educational and Institutional Effectiveness, had watched the search for that missing piece for years, first as an observer and then as a champion of the product known as HelioCampus Labor Cost Analytics.

An illustration of two people supporting a purple line graph that trends upward to end at a circular icon with a white dollar sign.

"There's not another product that actually provides you with reliable administrative benchmarking across higher education. The way HelioCampus provides it - our internal teams would never be able to do this."

Braden Hosch

Vice President for Educational and Institutional Effectiveness

The solution: Bringing independent, comparable data to the table

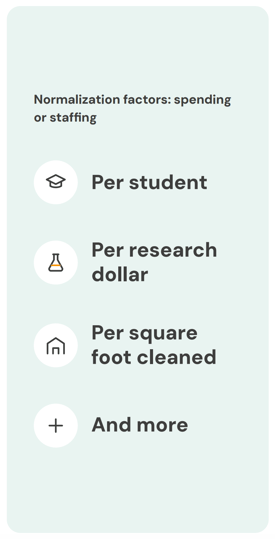
HelioCampus Labor Cost Analytics gave Stony Brook a range of normalization factors — spending or staffing per student, per research dollar, per square foot cleaned, and more — so comparisons account for an institution's size and mission rather than raw totals alone. For a large, research-intensive university, that distinction mattered.


"We're smaller than a number of the other public AAU institutions, so it's not just that we're always at the bottom. We get to see where we are on a per-student or per-faculty basis," says Hosch.


Normalization factors: spending or staffing

A localized view

Beyond leadership presentations and consulting, Stony Brook also adopted DataFlex to deliver unit-level records and summary benchmarks on a daily or weekly basis directly into the institution's own Tableau environment. That gave Stony Brook's team the ability to trend the data, build reports by unit, and localize it to the way each part of campus actually describes its own work.


Hosch shares, "In the HelioCampus standard activity model, advising and student services are described across the whole campus. But some units say, I'm the advising unit - we need to localize and look at the spend that way. Being able to look at it the way our staff and faculty look at the world is really, really valuable."


An illustration of two people using a tablet to analyze floating business icons, including a pie chart and a team metric.

Building a culture where the data is trusted

Good labor cost benchmarking data does little if no one believes it. Stony Brook built a data governance structure with clear stewardship responsibilities and data dictionaries, and — for labor cost data specifically — a cross-functional process where finance, budget planning, and financial analysis teams work directly with units to map position descriptions to the standard activity model themselves.

"Everyone's got skin in the game, everyone has put eyes on the data, and so when it's summarized, people trust it. And if it's wrong, it's not somebody else's fault — you were involved in that too, and that matters."

Braden Hosch

Vice President for Educational and Institutional Effectiveness

The results: A foundation for strategic planning

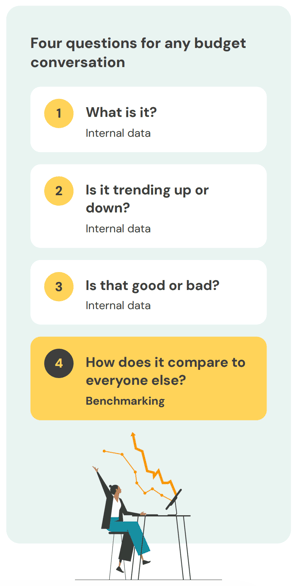
Paired with Stony Brook's internal trend analysis, Labor Cost Analytics now gives leaders a second, essential lens: how the institution's investment compares to where it wants to be. Hosch trains his own team, and the broader institutional research community, to walk into any budget conversation ready to answer four questions: what is it, is it trending up or down, is that good or bad, and how does it compare to everyone else. Internal data can usually answer the first three. Benchmarking is what answers the fourth — and increasingly, Stony Brook treats that answer as a standing resource rather than a one-time report. That resource is already showing up in new places across campus. Stony Brook drew on its HelioCampus data as an evidence exhibit in its most recent accreditation self-study and has built a library of benchmark slides for the President's Advisory Budget Committee to use going forward.

What's next

Asked to describe HelioCampus in a word, Hosch didn't hesitate: forward-looking. He pointed to the direction of the full HelioCampus product suite — data, AI, reporting, and benchmarking increasingly working inside one connected environment — as reason for confidence.

Four questions for any budget conversation

"The organization is really looking at how to provide cradle-to-grave services inside this ecosystem, so that you can be inside an environment where things are relatively seamless — from the data, to an AI layer, to reporting, to benchmarking."

Braden Hosch

Vice President for Educational and Institutional Effectiveness

Ready to see where your resources are going—and where they could go further?

See what trusted labor cost benchmarking can do for your institution.

Request a Demo